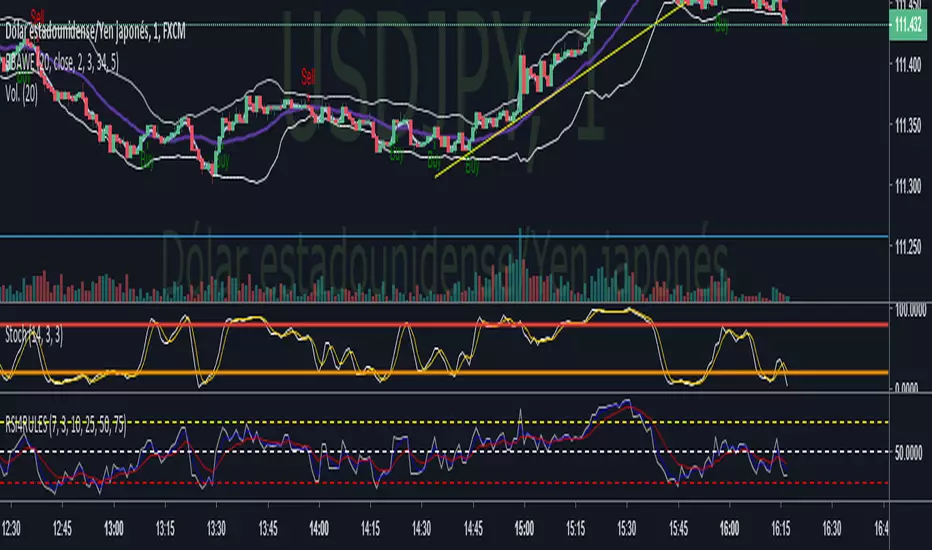
Evan Cabral Binary Strategy 2 / Lobowass Binary SignalThe script contains 1 Bollinger band with 2 different deviations also incorporated with a maximum and minimum of 30 minutes in green and red and a maximum and minimum of 4 hours in fuchsia. Also a 200 period EMA .
The red arrows appear whenever the stochastic , the DMI-stochastic and the two stochastics RSI are overbought and the low of the candle is breaking the bollnger band.
The green arrows appear whenever the stochastic , the DMI-stochastic and the two stochastics RSI are oversold and the high of the candle is breaking the bollnger band.
What makes this script unique is the combination of different indicators to give a buy or sell signal made by Edrul_Alejandro.
Indicator parameters:
Stochastic = (14,3,3) / (80,20)
Stochastic RSI 1 = (3,3,14,14) / (80,20)
Stochastic RSI 2 = (3,3,6,6) / (80,20)
Stochastic DMI = (10.3) / (90.10)
Bollinger band 1 = (34,2.0)
Bollinge band 2 = (34,2.5)
EMA = 200
Cari dalam skrip untuk "the script"

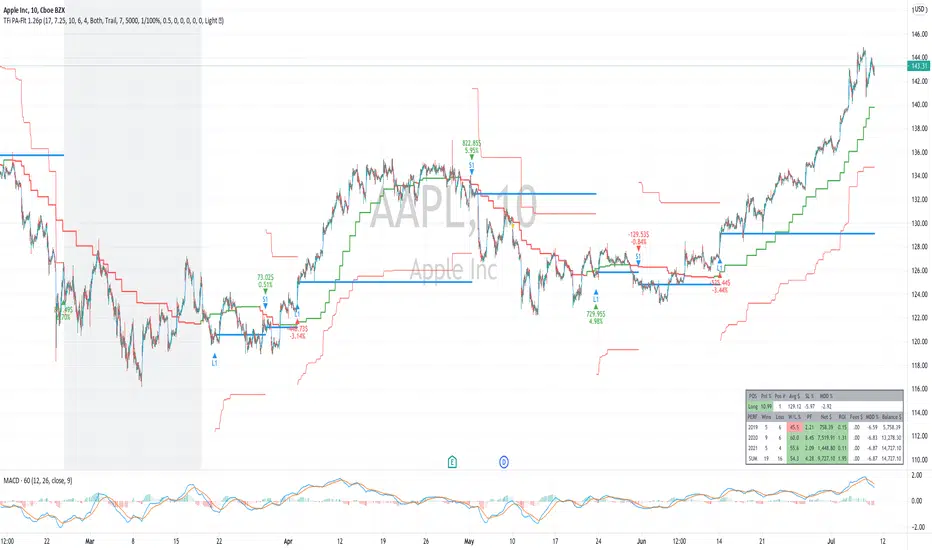
TFi Price Action Resampling Filter V1The script is resampling the price based on its range/price-action and creates an alternative filter to smoothen price movements.
Overview of features:
Optional stop-loss
Optional flags to control the position entry
Optional flags to control the position exit
Built-in backtesting engine with start balance, position size and pyramiding
Inputs for a percentage entry and exit slippage, entry/exit and daily funding fees
Configurable alerts, which follow the exact position of the entry/exit marker
Alert messages contain predefined trading instruction to execute orders via Alertatron or TradeFab's proprietary trading server
The script renders a status box at the last bar, which shows the current position status and result of the built-in trading simulation results.
It shows the following statistic values:
Current position PnL - also background turns green if position is in profit and red if in loss
Average entry price and number of positions
Current percentage distance to the optional stop-loss level
Current Maximum Draw Down
Overall number of wins and losses and the win/loss ratio
Overall profit and loss amount, paid fees
Overall profit-ratio and Maximum Draw Down
Overall balance and ROI
MA Strategy Emperor insiliconotThe Script offers 9 different EMAs with 14 different MA types.
The make use of the script is to find the entry on the 1-4 hour altcoins while using the in-built 13/21 crossover strategy to be used in sync with Heikin Ashi cross-over with Fib levels of 0.236 Fib level.
How to use it.
Entry is to be made when the
1. Cross over gives a P(Positive Sign) and the candle completely closes above the cross-over
2. When the Heikin Ashi turns green and the next green HA candle goes above the previous green HA candle.
3. The price should be at-least above the 0.236 Level from the Swing high.
All the Best.
EmperorBTC

Autocorrelation strategy The script is purely mathematical, I plan to add a lot more to the script but for now it shows the autocorrelation 1 and 2 years into the past
(Only works with daily setting)
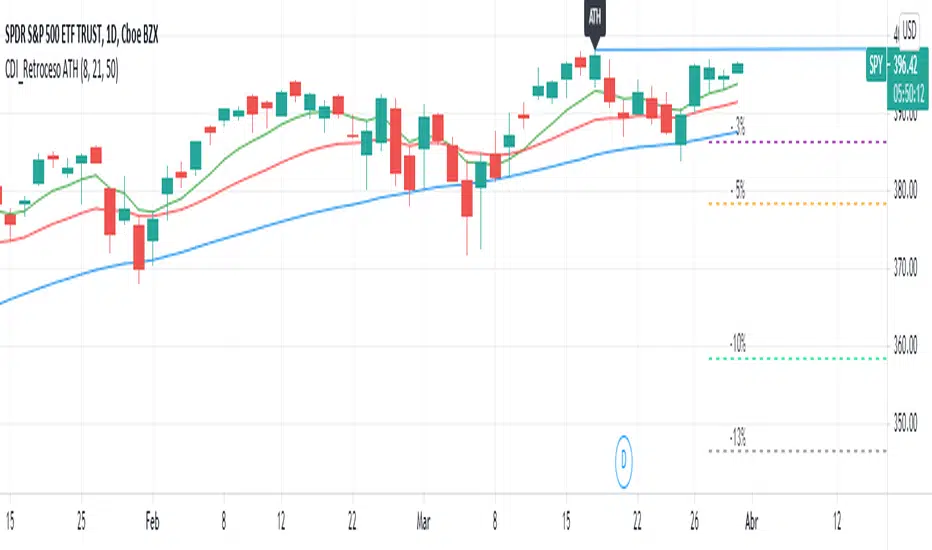
Retroceso 3%, 5%, 20% desde ATHThe Script shows us the% retracement that an action or ETF normally makes after it reaches its ATH, it also allows us to see the EMA 8, 21 and the MA 50 that show us the trend
El Script nos muestra el % de retroceso que normalmente hace una acción o ETF después que llega a su ATH, también nos permite ver las ver las EMA 8, 21 y la MA 50 que nos muestran la tendencia
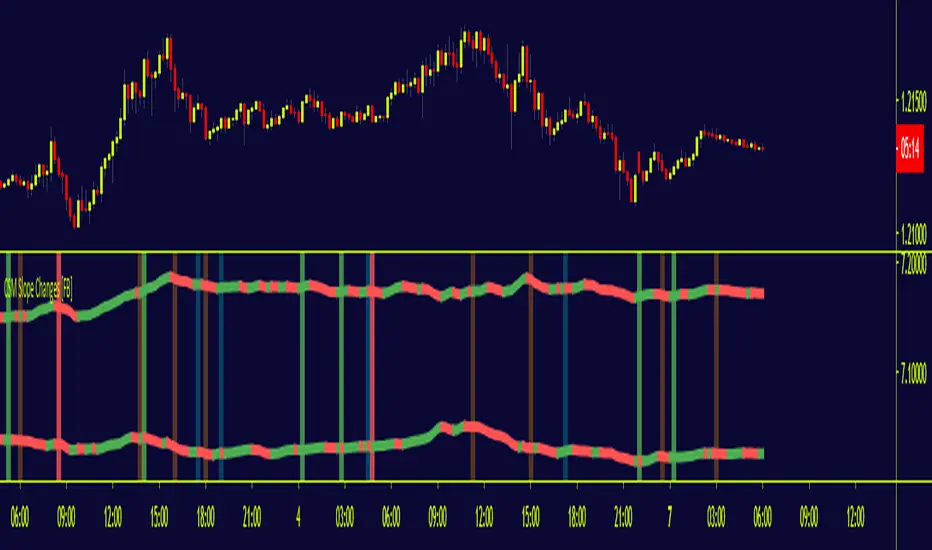
CSM Slope Changes [FB]The script highlighted in this chart is what I call the slope changes of the CSM trigger lines,. The trigger lines refer to a special non-lagging moving average derived off currency indices that will act as the potential signal to enter into positions if the rest of conditions as part of the CSM strategy agree. The script acts as an inflection point when an imbalance of flows in currency indices are expected based on the slope of the CSM trigger lines.
When the signal occurs, an area will be colored in green (long) or red (short), depending on the trade direction, of the quality of the signal is sudden in nature. If the slope change doesn't not happy in synchronicity but there is a delay of 1 candle in either index, the color of the signal will be in blue (long) or orange (short).
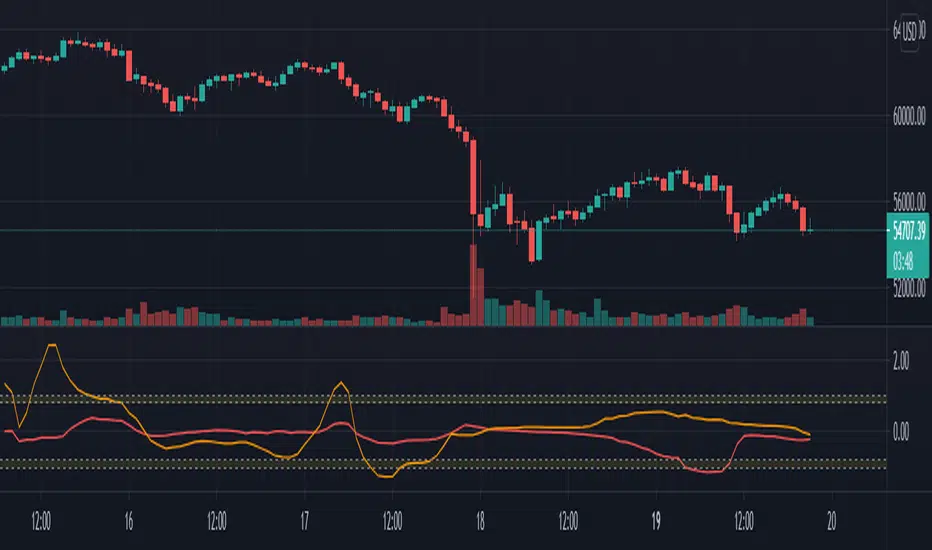
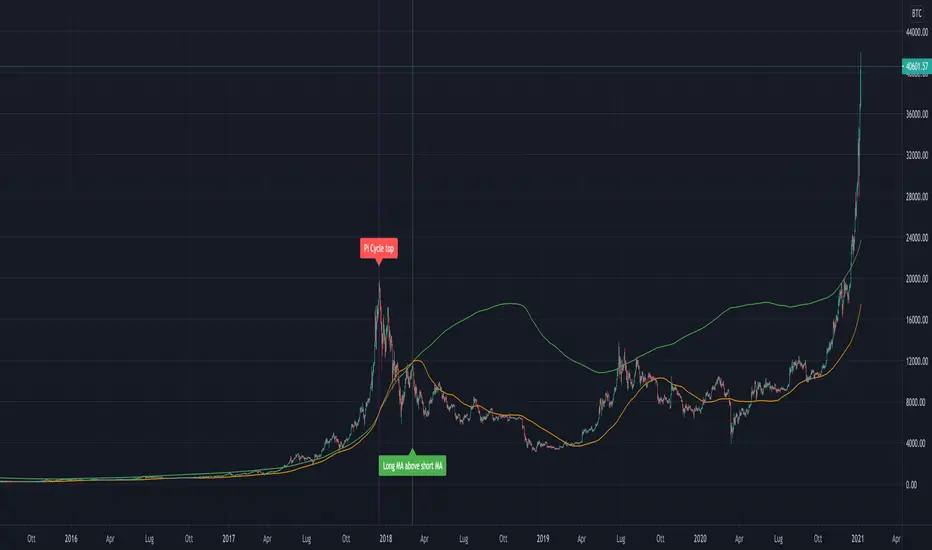
Pi Cycle Bitcoin Top IndicatorThe script implements the Pi Cycle Top indicator
This indicator identifies tops in the bitcoin market cycle. Historically, the Pi Cycle Top indicator has called out tops in the price of bitcoin within three days.
The script is very easy to use and it is possible to change the following parameters:
the time interval (default value is day);
the days of long moving average (default value is 365)
the days of short moving average (default value is 111)
show the moving average plots
show the Pi Cycle Top label highlighting the cross-point
Cumulative Volume v3The script, for Pine Script version 3, shows how to accumulate volume values during a defined session/period.
The input is the period to use for accumulation. "D" is the default value, useful to view data for each session.
This is slower than version 4 because there is no "var" and you need to use a loop. Also, you can't use "sum( volume , cnt_new_day)" with a variable length argument instead of "for".

EMA21 Speed & AccelThe script calculates an plots first and second derivatives of a EMA of "length" periods, with a default value of 21 periods.
- Blue curve is the first derivative of the EMA, which can be interpreted as the "speed" , "slope", or percentage of gains (or loses) walking over the EMA, measured in % per period. If timeframe is Days, it will show a %/day on the scale @ the right of graphic.
- Fuchsia curve is the second derivative of the EMA, and can be assumed to be the "acceleration" or driving force that could augment or diminish the EMA Speed.
When Speed & Acceleration ar both >=0, EMA is in positive rally, and becoming stepper, so the bacground is colored green.
First and second derivatoves are performed using "basis functions", as are applied in FEM implementation.
--------------------------------------------------------------------------------------------------------------------------------------------------------------------------------------
El Script calcula y plotea la primera y segunga derivada de una EMA de "length" períodos, con un valor por defecto de 21.
- La curva azul es la primera derivada de la EMA; que puede ser interpretada conmo su "velocidad", "pendiente" o % de ganancia o pérdida que se tendría sobre la EMA. Cuando la unidad de tiempo del gráfico es Días, permite visualizar en la escala de la derecha el % de ganancia o pérdida por día.
- La curva Fucsia muestra la segunda derivada, o "Aceleración", que se puede interpretar como la fuerza que puede aumentar o dismu¿inuir la pendiente de la EMA.
Cuando la Velocidad y Aceleración son mayores que cero, las ganancias aumentan cada período, y el findo de colorea de verde.
Las derivadas primera y segunda se calculan usando técnicas de funciones de forma, como las aplicadas en el MEF.

MarketStructureBreakThe Script is called a MSB/MarketStructureBreak
This script is meant to teach you on how the 2 candles are responsible for the breakout and shows you patience
The best way to use this indicator is by putting the "SMA 50 SMA 200" settings helps filter out the false calls
As well, if you use this in a bigger time frame like 1 HOUR, 4 HOUR, Daily, and Weekly it will call the best buy and sell Signals

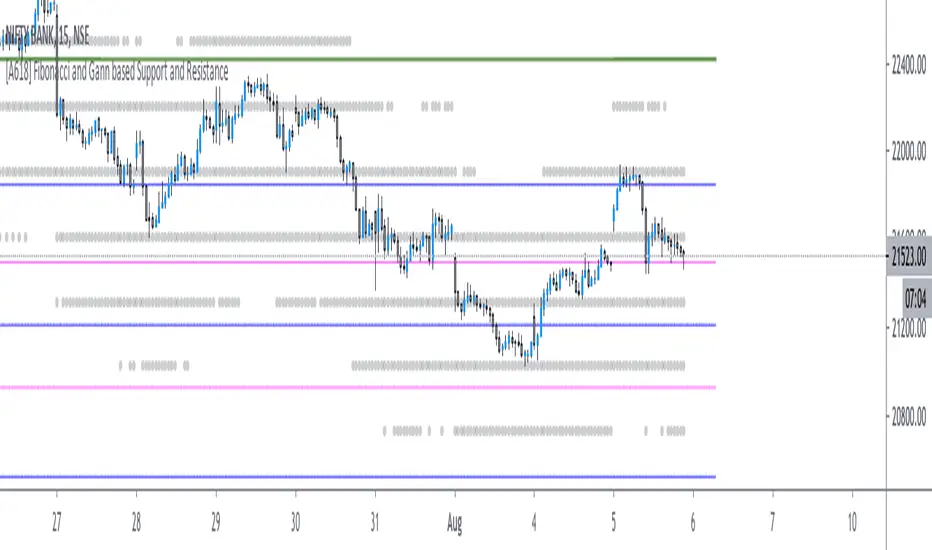
[A618] Fibonacci and Gann based Support and ResistanceThe scripts plots,
Gann and Fibonacci Levels onto the charts taking into account the price action of past 1 year,
The plots are plotted dynamically
Enjoy !
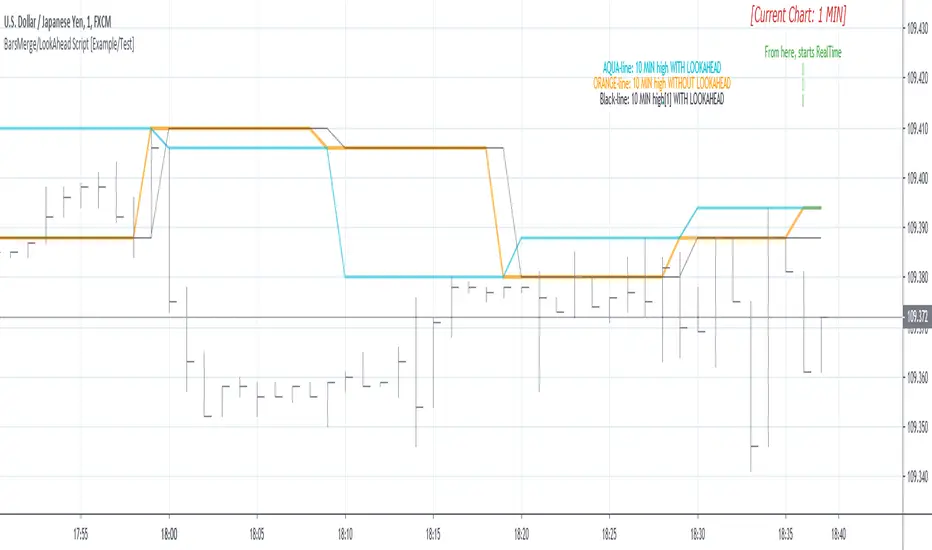
BarsMerge/LookAhead Script [Example/Test]The script shows and explains to users how BarsMerge-LookAhead ON/OFF changes the behavior of the results.
After you see this and understand, it's important that coders noted the differences and used best practices in implementing the "security" function for their indicators and strategies.
CriptoImpulso - InOut The script evaluates several indicators such as moving average, exponential moving average and other indicators, to make a decision and show a possible opportunity for entry and exit. In addition to the entry and exit, pivots are provided based on the values of daily closures, to find supports and resistances.
This script works with low timeframes (1,3,5,15) and is easy to use, the green label arrows below the candles show the possible entries and the magenta label arrows above the candles show the possible exits.

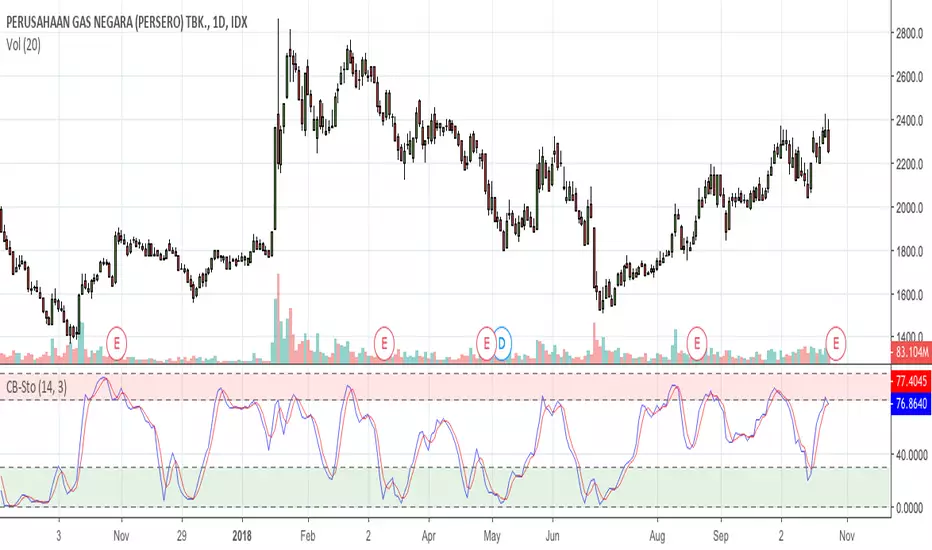
ChartBite Swing Stochastic - LiteThe script is simply to show Stochastic with overbought and oversold area with colors.
Red : Overbought Area (level 80-100)
Green : Oversold Area (level 0-20)
All colors and parameters can be changed to your needs, but I suggest leave it as default.
The crossing in oversold are is a timing to entry long.
and the crossing in overbought area is to entry short (to sell)
ChartBite Swing Stochastic - Lite can be combined with the ChartBite Swing Indicator - Lite to create signals.
This script is Invite Only but It's free to use, just send me message, and I'll grant access to you.
Success and Profit Always
Salam Sukses dan Cuan Selalu
RSI4RULESThe Script is for use with the strategy of the 4 rules of Daven Icao. It is an RSI (black) with two Emas, 3 (blue) and 10 (red). To buy the RSI is expected to cross with the Emas in oversold zone, which is level 25; level 75 is an overbought area where we expect the RSI to cross with the Emas. If you consider that this script can be used in another strategy, use it! You can modify the values of the RSI and the Emas.
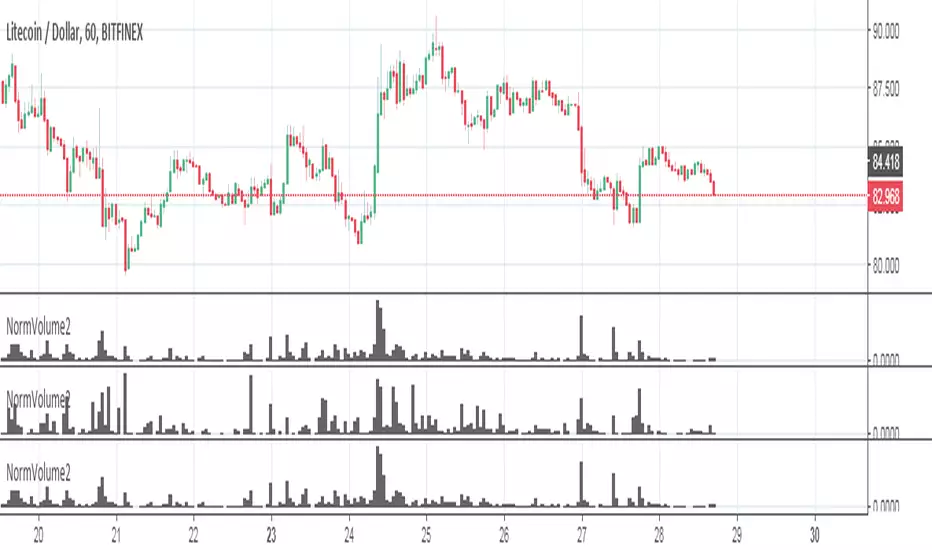
BBP (Bittex, Poloniex, Bitfinex) + standart volumeThe script wrote for pairs of crypto currency with XXX USD. On others it does not work. By and large, it is suitable only for analysis of TOP coins.
What it consists of:
The script pulls volumes from exchanges: Bitfinex, Bittrex, Poloniex + the volume of the coin itself through the dollar indicator normalized.
Based on the volume from the indicator "dollar normalized volume"
Works with pairs XXX USD (do not confuse with USDT)
Test for IQoption chat by Noah NThe script uses the average price of Major currencies to show their relative strength. Choose which currencies you wish to see in the format options. The script works based off of RSI so the currency with a higher value is stronger than the currency with the lower value. If for example USD is at 65 and CAD is at 30 then USD is stronger than CAD and buying USDCAD is better idea than selling it.
Sourcecode is open to see.

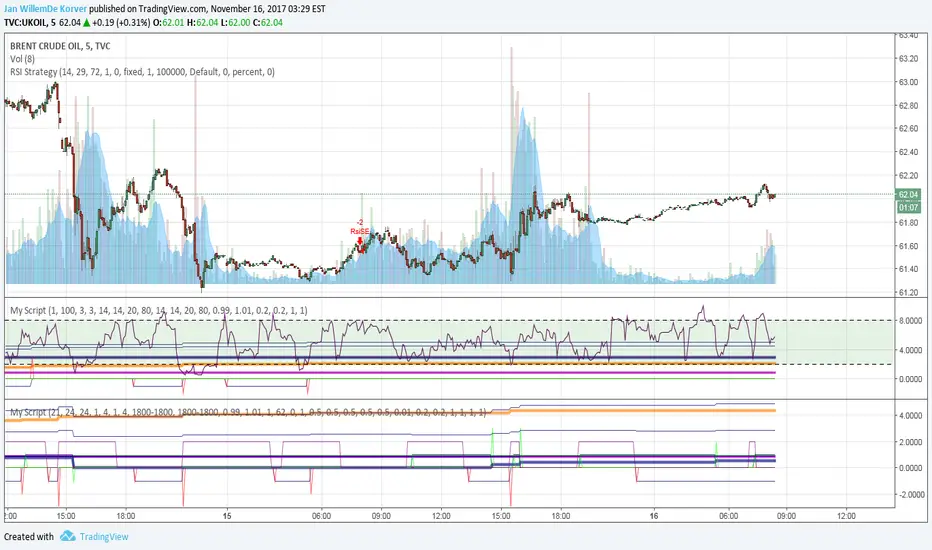
Price X volume relative trade algoThe script multiplies the price time the volumes. Than relatively calculates whether the stock or product is oversold or overbought. One can subsequently set when to go short or when to go long. The way it works is that there is a small 1 for a long and a -1 for a short. If it is 1 and the followed by a 2 one has a profit. If a -1 is followed by a -2 you traded a short with a profit.
If however a 1 is followed by a -1 you lost a long. Vice verse for the short: if the -1 is followed by a 1 you have a loss.
Once can also set a target and arrange the stop loss they way you want. A little bit complicated with many parameters to set in the setting window. But for the one who has the patient to understand the script I believe it can be very useful.
Jan de Korver:
Search the secret www.behance.net
PersonsPivots-UpdatedThe script was written by another script writer and it worked fine with Futures, Forex and ETFs but had a Runtime error for stocks so I had a coder friend do a debug


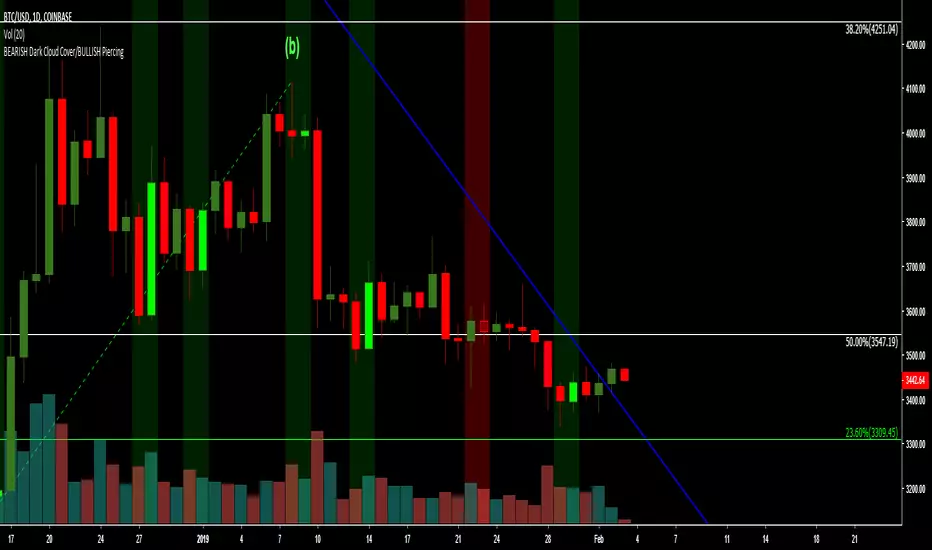
BEARISH Dark Cloud Cover/BULLISH PiercingThe script highlights the 2 candlesticks pattern: BEARISH Dark Cloud Cover/BULLISH Piercing on the main chart screen, and has a preset alert condition. Please use an oscillator that shows oversold and overbought conditions with this script (i.e. StochRSI oscillator).
EngulfingThe script highlights a Bullish/Bearish Engulfing 2 candlesticks pattern on the main chart screen, and has a preset alert condition. Please use an oscillator that shows oversold and overbought conditions with this script (i.e. StochRSI oscillator).

Divergence/Convergence v1.0 [LonesomeTheBlue]The script is developed to find Divergence/Convergence for various indicators
it counts number of Divergence/Convergence and draws arrow
Arrow length changes according to number of Divergence/Convergence
that means if there is Divergence/Convergence on one indicator then arrow length = 1
if there is Divergence/Convergence on two indicator then arrow length = 2 etc.
Currently script checks Divergence/Convergence for RSI, MACD, MACD Histogram, Momentum, CMF indicators
You can add/remove many other indicators to check if there is Divergence/Convergence
